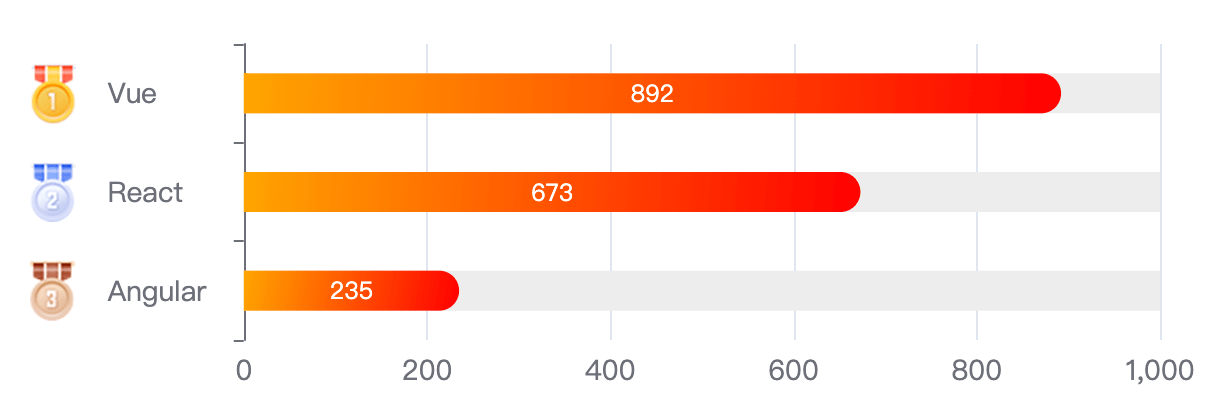
echarts 在 Y 轴标签中显示图片

完整代码
通过 echarts 显示一个排名图表,在名称前面还需要给出对应的排名小图标用于区分。
主要还是通过 formatter 和 rich 富文本样式来实现。
<script setup lang="ts">
import { onMounted } from 'vue'
import * as echarts from 'echarts'
import IconRanking1 from '@/assets/img/ranking1.png'
import IconRanking2 from '@/assets/img/ranking2.png'
import IconRanking3 from '@/assets/img/ranking3.png'

onMounted(() => {
    const data: Array<{ name: string; value: number }> = [
        { name: 'Vue', value: 892 },
        { name: 'React', value: 673 },
        { name: 'Angular', value: 235 }
    ]

    const icons = [IconRanking1, IconRanking2, IconRanking3]
    const richConfigs = data
        .map((element, index) => {
            const key = encodeURIComponent(element.name).replace(/%/g, '')
            return {
                [key]: {
                    fontSize: 30,
                    align: 'left',
                    backgroundColor: {
                        image: icons[index]
                    }
                }
            }
        })
        .reduce((a, b) => Object.assign(a, b), {})

    const options: echarts.EChartsOption = {
        grid: {
            left: '20px',
            containLabel: true
        },
        xAxis: {
            type: 'value',
            name: '',
            axisLabel: {
                fontSize: 14,
                formatter: '{value}'
            }
        },
        yAxis: {
            type: 'category',
            inverse: true,
            data: data.map((element) => element.name),
            axisLabel: {
                formatter: (name) => {
                    return `{${encodeURIComponent(name).replace(/%/g, '')}|}{name|${name}}`
                },
                rich: {
                    name: {
                        align: 'left',
                        width: 60,
                        padding: [0, 0, 0, 16],
                        fontSize: 14,
                        lineHeight: 30
                    },
                    ...richConfigs
                }
            }
        },
        series: [
            {
                type: 'bar',
                barWidth: 20,
                data: data.map((element) => element.value),
                label: {
                    show: true,
                    color: '#FFFFFF'
                },
                showBackground: true,
                backgroundStyle: { color: '#EDEDED' },
                itemStyle: {
                    color: new echarts.graphic.LinearGradient(0, 0, 1, 1, [
                        { offset: 0, color: 'orange' },
                        { offset: 1, color: 'red' }
                    ]),
                    borderRadius: [0, 10, 10, 0]
                }
            }
        ]
    }
    const chartInstance = echarts.init(document.getElementById('chart')!)
    chartInstance.setOption(options)
})
</script>

<template>
    <div id="chart" style="width: 650px; height: 300px"></div>
</template>

<style lang="scss"></style>
富文本样式的配置项 key 值不支持中文,所以本例中将中文进行了 URLEncode 处理,你可以自行处理,如:MD5 等。